Little Ice Age as base

Warmists like to start charts of at the end of the little Ice Age 1950 or the dip afterwards at 1980. And then work their way up to the Grand solar Maximum.

Yes modern instruments start about then, but it’s also a nice cherry pick of a lowpoint for warmists and they used it for everything.


Below are some charts looking further back:global-temperature-last-10000-years.jpgpost-88603-0-98994800-1378946506.png


Fuel Poverty


44,0000 excess winter deaths – fuel poverty
http://www.mirror.co.uk/news/uk-news/44000-brits-died-winter-last-6896677

Fuel poverty kills more people than road accidents
AT least 2,700 people die every winter because they
can’t afford their soaring heating bills.
http://www.mirror.co.uk/news/uk-news/fuel-poverty-kills-more-people-86673

Elderly person dies every SEVEN minutes due to fuel poverty ‘scandal’
Every winter, 25,000 older people in England and
Wales do not survive the bitter weather
– 206 deaths a day.
http://www.express.co.uk/news/uk/533907/Elderly-person-dies-every-SEVEN-minutes-fuel-poverty-scandal

High energy costs ‘will kill 100,000 in cold homes’
From April, a typical household will pay £107 to the
Treasury out of a typical £1,350 annual energy bill.
The taxes are comprised of £68 in VAT, £28 for the UK’s
unilateral carbon tax and £11 for the European carbon
tax, the charity calculates.
http://www.telegraph.co.uk/news/earth/energy/11437647/High-energy-costs-will-kill-100000-in-cold-homes.html

http://www.energybillrevolution.org/news/cold-kills-more-in-temperate-britain-than-freezing-sweden/

No sea level curve

No sea level rise:

given that the absolute global sea level rise
is believed to be 1.7-1.8 millimeters/year. 1.7mm x 100 = 17cm.
6.69 inches.
http://tidesandcurrents.noaa.gov/sltrends/globalregional.htm

IPCC states man is responsible for climate since 1950.

So where is the upward curve that deviates from nature?

http://tidesandcurrents.noaa.gov/sltrends/sltrends_station.shtml?stnid=8724580

http://tidesandcurrents.noaa.gov/sltrends/sltrends_global_station.htm?stnid=170-101

http://tidesandcurrents.noaa.gov/sltrends/sltrends_global_station.htm?stnid=680-140

Find the curve?
http://tidesandcurrents.noaa.gov/sltrends/sltrends_global.htm

CALIFORNIA

CALIFORNIA:

And reports suggest recent weather with its rain
is the anomaly and the desert is the norm.

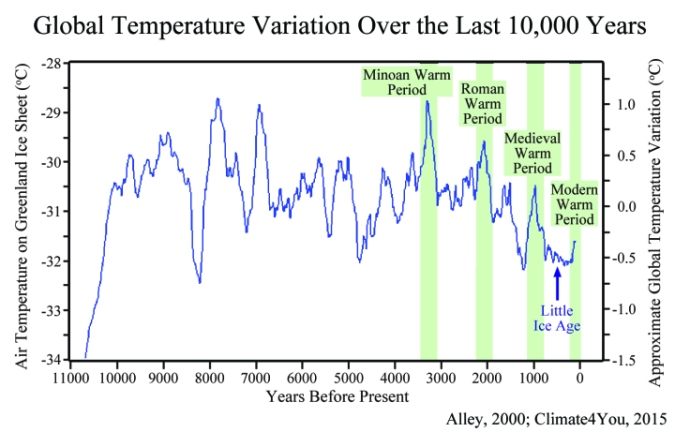
“the past century has been among the wettest
of the last 7,000 years.”

“researchers have documented multiple droughts
in California that lasted 10 or 20 years in a row
during the past 1,000 years”

“The two most severe megadroughts make the Dust
Bowl of the 1930s look tame: a 240-year-long drought
that started in 850 and, 50 years after the conclusion
of that one, another that stretched at least 180 years.!

See how you can get a distorted picture if you only count
from after 1900.
http://www.mercurynews.com/portlet/article/html/imageDisplay.jsp?contentItemRelationshipId=5689627
http://www.mercurynews.com/science/ci_24993601/california-drought-past-dry-periods-have-lasted-more

“Drawing water excessively from these underground
stores may also harm the very structure of those reserves,
potentially shrinking their overall capacity so that they
won’t be able to hold as much water again in the future”
http://www.ibtimes.com/california-groundwater-crisis-grows-during-critical-drought-farmers-pump-water-wells-1870422

IPCC – CO2 is well mixed in atmosphere myth – falsified

IPCC – CO2 is well mixed in atmosphere myth, falsified.
————–
“It seems clear that we don’t quite understand the
relationship between the lower atmosphere and the
upper atmosphere,” said Diego Janches, TIMED project
scientist at NASA’s Goddard Space Flight Center
in Greenbelt, Maryland.
http://www.spacedaily.com/reports/How_TIMED_Flies_Unexpected_Trends_in_Carbon_Data_999.html